原子軌道のリスト


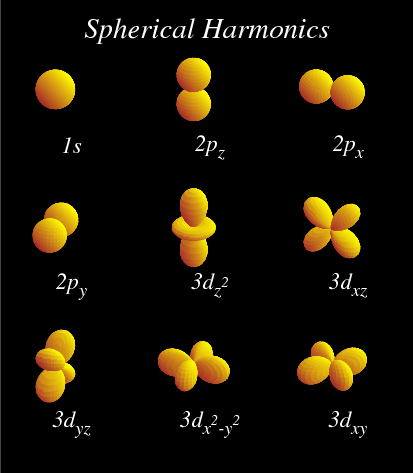
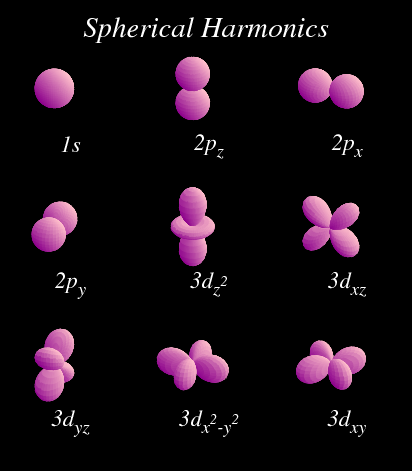
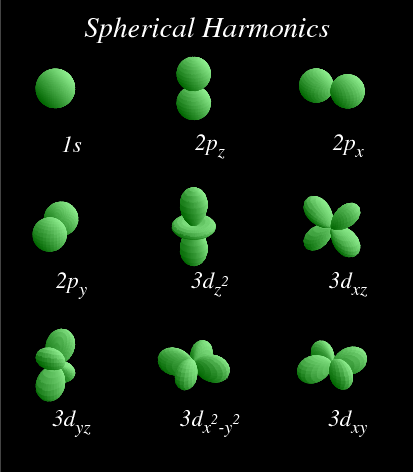
3次元グラフの表面の色づけの項で説明した「光の当たっている物体に見える色のつけ方」を利用して、原子軌道の角度部分Y(theta,phi)のリストを作成しました。下のスクリプトを実行すると、こちらのような4ページのPostScriptファイルが出来ます。それぞれのページに上図のように色使いの違う図が出来ます。
#version 4.2.4

if (exist("n")==0) n=0

if (n==0 || n==1) set palette defined ( 0 "dark-blue" , 1 "cyan")
if (n==2) set palette defined ( 0 "brown" , 1 "yellow")
if (n==3) set palette defined ( 0 "dark-magenta" , 1 "pink")
if (n==4) set palette defined ( 0 "dark-green" , 1 "light-green")

h=0.000001

lx=2.0
ly=1.0
lz=1.0

# 表面の媒介変数関数
Y(u,v)=sqrt(5.0/(4.0*pi))*0.5*(3.0*cos(u)**2-1)
Fx(u,v)=sin(u)*cos(v)*abs(Y(u,v))
Fy(u,v)=sin(u)*sin(v)*abs(Y(u,v))
Fz(u,v)=cos(u)*abs(Y(u,v))

# 光の方向
sx=1.0
sy=1.0
sz=1.0

# 微分用の微小数
h=0.000001

# Fx,Fy,Fzのuおよびvによる偏微分
dFxu(u,v)=(Fx(u+h,v)-Fx(u-h,v))/(2.0*h)
dFyu(u,v)=(Fy(u+h,v)-Fy(u-h,v))/(2.0*h)
dFzu(u,v)=(Fz(u+h,v)-Fz(u-h,v))/(2.0*h)
dFxv(u,v)=(Fx(u,v+h)-Fx(u,v-h))/(2.0*h)
dFyv(u,v)=(Fy(u,v+h)-Fy(u,v-h))/(2.0*h)
dFzv(u,v)=(Fz(u,v+h)-Fz(u,v-h))/(2.0*h)

# 法線ベクトルの各成分 n = lu x lv
nx(u,v)=dFyu(u,v)*dFzv(u,v)-dFyv(u,v)*dFzu(u,v)
ny(u,v)=dFzu(u,v)*dFxv(u,v)-dFzv(u,v)*dFxu(u,v)
nz(u,v)=dFxu(u,v)*dFyv(u,v)-dFxv(u,v)*dFyu(u,v)

# 光の方向ベクトルsの長さ
s_length=sqrt(sx**2+sy**2+sz**2)
# 法線ベクトルnの長さ
n_length(u,v)=sqrt(nx(u,v)**2+ny(u,v)**2+nz(u,v)**2)

# 光の方向ベクトルsと表面の法線ベクトルnの内積で色を決める
light(u,v)=(n_length(u,v)!=0.0 ? \
            (sx*nx(u,v)+sy*ny(u,v)+sz*nz(u,v))/(s_length*n_length(u,v)) :\
            light(u+h,v+h))

set parametric
set isosamples 60
set samples 30
set angles radians

# 一列目にtheta、二列目にphiの値の入ったファイルを作る。
if (n==0) tablefile="theta-phi.dat";\
     set urange [0:pi];\
     set vrange [0:2*pi];\
     set table tablefile;\
     splot u,v,0;\
     unset table


set multiplot layout 3,3 rowsfirst scale 1.6,1.6 offset 0,0.08

set tmargin 0
set bmargin 0
set rmargin 0
set lmargin 0

set object 1 rect from screen 0,0 to screen 1,1.15 \
             fs solid noborder fc rgb "black"
set label 5 at screen 0.5,1.08 center \
            "{/Times-Italic=25 Spherical Harmonics}" tc rgb "white"

set xrange [-0.65:0.65]
set yrange [-0.65:0.65]
set zrange [-0.65:0.65]
set pm3d depthorder
set view 60,20
set size ratio 1

unset key
unset colorbox
set border 0
unset xtics
unset ytics
unset ztics

Y(u,v)=1.0/sqrt(4.0*pi)
orbital="1s"
set label 1 at graph 0.8,0.2 center sprintf("{/Time-Italic=20 %s}", orbital) tc rgb "white"
splot tablefile using (Fx($1,$2)):(Fy($1,$2)):(Fz($1,$2)):(light($1,$2)) with pm3d

unset object
unset label 5

Y(u,v)=sqrt(3.0/(4.0*pi))*cos(u)
orbital="2p_z"
set label 1 at graph 0.8,0.2 center sprintf("{/Time-Italic=20 %s}", orbital) tc rgb "white"
splot tablefile using (Fx($1,$2)):(Fy($1,$2)):(Fz($1,$2)):(light($1,$2)) with pm3d

Y(u,v)=sqrt(3.0/(4.0*pi))*sin(u)*cos(v)
orbital="2p_x"
set label 1 at graph 0.8,0.2 center sprintf("{/Time-Italic=20 %s}", orbital) tc rgb "white"
splot tablefile using (Fx($1,$2)):(Fy($1,$2)):(Fz($1,$2)):(light($1,$2)) with pm3d

Y(u,v)=sqrt(3.0/(4.0*pi))*sin(u)*sin(v)
orbital="2p_y"
set label 1 at graph 0.8,0.2 center sprintf("{/Time-Italic=20 %s}", orbital) tc rgb "white"
splot tablefile using (Fx($1,$2)):(Fy($1,$2)):(Fz($1,$2)):(light($1,$2)) with pm3d

Y(u,v)=sqrt(5.0/(4.0*pi))*0.5*(3.0*cos(u)**2-1.0)
orbital="3d_{z^2}"
set label 1 at graph 0.8,0.2 center sprintf("{/Time-Italic=20 %s}", orbital) tc rgb "white"
splot tablefile using (Fx($1,$2)):(Fy($1,$2)):(Fz($1,$2)):(light($1,$2)) with pm3d

Y(u,v)=sqrt(15.0/(4.0*pi))*(sin(u)*cos(u)*cos(v))
orbital="3d_{xz}"
set label 1 at graph 0.8,0.2 center sprintf("{/Time-Italic=20 %s}", orbital) tc rgb "white"
splot tablefile using (Fx($1,$2)):(Fy($1,$2)):(Fz($1,$2)):(light($1,$2)) with pm3d

Y(u,v)=sqrt(15.0/(4.0*pi))*(sin(u)*cos(u)*sin(v))
orbital="3d_{yz}"
set label 1 at graph 0.8,0.2 center sprintf("{/Time-Italic=20 %s}", orbital) tc rgb "white"
splot tablefile using (Fx($1,$2)):(Fy($1,$2)):(Fz($1,$2)):(light($1,$2)) with pm3d

Y(u,v)=sqrt(15.0/(4.0*pi))*0.5*(sin(u)**2*cos(2*v))
orbital="3d_{x^2-y^2}"
set label 1 at graph 0.8,0.2 center sprintf("{/Time-Italic=20 %s}", orbital) tc rgb "white"
splot tablefile using (Fx($1,$2)):(Fy($1,$2)):(Fz($1,$2)):(light($1,$2)) with pm3d

Y(u,v)=sqrt(15.0/(4.0*pi))*0.5*(sin(u)**2*sin(2*v))
orbital="3d_{xy}"
set label 1 at graph 0.8,0.2 center sprintf("{/Time-Italic=20 %s}", orbital) tc rgb "white"
splot tablefile using (Fx($1,$2)):(Fy($1,$2)):(Fz($1,$2)):(light($1,$2)) with pm3d


unset multiplot

set size 1,1.15

N=4
print n
if (n==0) pause -1;\
     set out "spherical-harmonics.ps";\
     set term post portrait color solid size 5in,5in enhanced;\

if (n < N) ;\
     TERM="PS";\
     n=n+1;\
     reread

n=-1
TERM="WIN"
set term win
set out