超伝導ギャップ構造
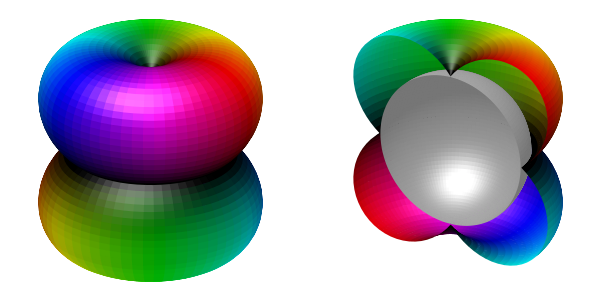
超伝導ギャップは複素関数ですので、振幅と位相の自由度を持ちます。この二つの自由度のフェルミ面上での変化を分かりやすくかつきれいに見せるための図を紹介します。ちなみに、こちらのレビュー記事で用いたものです。
これらの例では、かっこよく見せるために、開発版gnuplot 5.1で採用されているpm3dのlightningオプションを用いています。5.0系またはそれ以前のgnuplotでは使えないのでご注意ください。
3次元カイラルd波 kz(kx+iky)
上記のカイラルd波超伝導の場合、ギャップの絶対値は、θを波数空間での極角、φを波数空間での方位角として、|sin(2θ)|で与えられ、位相はφ+((sgn(cos(θ)))-1)*90°(0°と360°の間で定義する場合)となります。ギャップの絶対値と位相をそれぞれHSV色空間のVとHに割り振って、ギャップを表現します(参考: HSVサークル、孤立した渦糸(位相付き))。また、Fermi面上からの距離でもギャップの絶対値を表現します。
最終的に、以下のようなスクリプトとなり、これを実行すると、3D-chiral-d.pngという画像ファイルが精製されます。このファイルでは、上にあるように、ギャップの模式図に加えて、それを半分に切った場合の図を並べてあります。
########################## HSVをフルに使うための設定  ######################################

# HSV色空間からRGB色空間への変換。Wikipedia参照
HSV_Hi(h)=sgn(h)*floor(abs(h)/60.0)%6+(h>=0 ? 0 : 5)
HSV_f(h)=(sgn(h)*(abs(h)-(floor(abs(h))/360)*360.0)/60.0+(h>=0 ? 0 : 6))-HSV_Hi(h)
HSV2R(h,s,v)=( \
     HSV_Hi(h)==0 || HSV_Hi(h)==5 ? v                    : (\
     HSV_Hi(h)==1                 ? v*(1-HSV_f(h)*s)     : (\
     HSV_Hi(h)==4                 ? v*(1-(1-HSV_f(h))*s) : (\
     HSV_Hi(h)==2 || HSV_Hi(h)==3 ? v*(1-s)              : 0.0) )))
HSV2G(h,s,v)=( \
     HSV_Hi(h)==1 || HSV_Hi(h)==2 ? v                    : (\
     HSV_Hi(h)==3                 ? v*(1-HSV_f(h)*s)     : (\
     HSV_Hi(h)==0                 ? v*(1-(1-HSV_f(h))*s) : (\
     HSV_Hi(h)==4 || HSV_Hi(h)==5 ? v*(1-s)              : 0.0) )))
HSV2B(h,s,v)=( \
     HSV_Hi(h)==3 || HSV_Hi(h)==4 ? v                    : (\
     HSV_Hi(h)==5                 ? v*(1-HSV_f(h)*s)     : (\
     HSV_Hi(h)==2                 ? v*(1-(1-HSV_f(h))*s) : (\
     HSV_Hi(h)==0 || HSV_Hi(h)==1 ? v*(1-s)              : 0.0) )))

set angles degrees
# HSVサークルの動径方向分割数
N=50.0
colmax = N*360.0
set palette model RGB functions \
     HSV2R((gray*colmax/360.0-floor(gray*colmax/360.0))*360.0, 1,(floor(gray*colmax/360.0)/N)),\
     HSV2G((gray*colmax/360.0-floor(gray*colmax/360.0))*360.0, 1,(floor(gray*colmax/360.0)/N)),\
     HSV2B((gray*colmax/360.0-floor(gray*colmax/360.0))*360.0, 1,(floor(gray*colmax/360.0)/N))

set cbrange [0:colmax]

########################## HSVをフルに使うための設定 ここまで ######################################


############# 座標を格納するファイルの作成 ##############################

file = "angle.dat"
file_half = "angle_half.dat"

set urange [360:360+180.]
set vrange [0:360.]
set samples 63
set isosamples 63

set parametric
set zrange [0:1]
set table file
splot u,v,(0)
unset table


set urange [360:360+180.]
set vrange [0:180.]
set samples 63
set isosamples 63
set zrange [0:1]
set table file_half
splot u,v,(0)
unset table

############# 座標を格納するファイルの作成 ここまで ##############################


set term pngcairo size 600,300 font "Arial,12"
set out "3D-chiral-d.png"


kF  = 0.3   # Fermi波数
gap = 0.2   # ギャップの大きさ

Range = (kF+gap)*1.1

set xrange [-Range:Range]
set yrange [-Range:Range]
set zrange [-Range:Range]

set view 65,30
set view equal xyz
unset key

set border 0
unset xtics
unset ytics
unset ztics
unset colorbox


# pm3d: lightning オプションを含めて設定
set pm3d implicit at s hidden3d depth noborder
set pm3d lighting primary 0.3 specular 0.45
set pm3d corners2color min


set multiplot

### 左半分に、全体像をプロット ###
set tmargin screen 1
set bmargin screen 0
set rmargin screen 0.5
set lmargin screen 0


#### 超伝導ギャップ構造を定義する関数 ####
## ギャップの振幅
amp(theta,phi) = abs(sin(2*theta))
## ギャップの位相
phase(theta,phi)= phi+((sgn(cos(theta)))-1)*90


R(theta,phi) = kF + gap*amp(theta,phi)
R0(theta,phi) = kF *0.99

splot file using (R($1,$2)*sin($1)*cos($2)):(R($1,$2)*sin($1)*sin($2)):(R($1,$2)*cos($1)):\
     (floor(amp($1,$2)*N)*360.0+phase($1,$2)) nosurface


### 左半分に、一部が欠けた像をプロット Fermi面は灰色で ###
set tmargin screen 1
set bmargin screen 0
set rmargin screen 1
set lmargin screen 0.5


splot file_half using (R($1,$2)*sin($1)*cos($2)):(R($1,$2)*sin($1)*sin($2)):(R($1,$2)*cos($1)):\
     (floor(amp($1,$2)*N)*360.0+phase($1,$2)) nosurface ,\
      "" using (R0($1,$2)*sin($1)*cos($2)):(R0($1,$2)*sin($1)*sin($2)):(R0($1,$2)*cos($1)):\
     (0xAAAAAA) nosurface lc rgb variable

unset multiplot


set out
set term win

replot
3次元カイラルf波 (5kz2 - 1) (kx+iky)
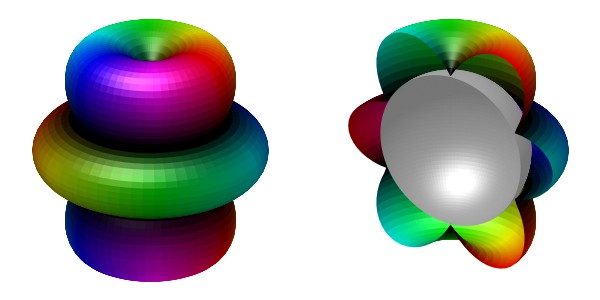
振幅と位相の波数依存性の部分を変更するだけで、他の場合のギャップ構造も描けます。以下は、カイラルf波状態のうちのE1uと呼ばれる状態で、波数空間でのギャップ構造は(5kz2 - 1) (kx+iky)のように書けます。青字になっているのが、変更した部分です。
########################## HSVをフルに使うための設定  ######################################

# HSV色空間からRGB色空間への変換。Wikipedia参照
HSV_Hi(h)=sgn(h)*floor(abs(h)/60.0)%6+(h>=0 ? 0 : 5)
HSV_f(h)=(sgn(h)*(abs(h)-(floor(abs(h))/360)*360.0)/60.0+(h>=0 ? 0 : 6))-HSV_Hi(h)
HSV2R(h,s,v)=( \
     HSV_Hi(h)==0 || HSV_Hi(h)==5 ? v                    : (\
     HSV_Hi(h)==1                 ? v*(1-HSV_f(h)*s)     : (\
     HSV_Hi(h)==4                 ? v*(1-(1-HSV_f(h))*s) : (\
     HSV_Hi(h)==2 || HSV_Hi(h)==3 ? v*(1-s)              : 0.0) )))
HSV2G(h,s,v)=( \
     HSV_Hi(h)==1 || HSV_Hi(h)==2 ? v                    : (\
     HSV_Hi(h)==3                 ? v*(1-HSV_f(h)*s)     : (\
     HSV_Hi(h)==0                 ? v*(1-(1-HSV_f(h))*s) : (\
     HSV_Hi(h)==4 || HSV_Hi(h)==5 ? v*(1-s)              : 0.0) )))
HSV2B(h,s,v)=( \
     HSV_Hi(h)==3 || HSV_Hi(h)==4 ? v                    : (\
     HSV_Hi(h)==5                 ? v*(1-HSV_f(h)*s)     : (\
     HSV_Hi(h)==2                 ? v*(1-(1-HSV_f(h))*s) : (\
     HSV_Hi(h)==0 || HSV_Hi(h)==1 ? v*(1-s)              : 0.0) )))

set angles degrees
# HSVサークルの動径方向分割数
N=50.0
colmax = N*360.0
set palette model RGB functions \
     HSV2R((gray*colmax/360.0-floor(gray*colmax/360.0))*360.0, 1,(floor(gray*colmax/360.0)/N)),\
     HSV2G((gray*colmax/360.0-floor(gray*colmax/360.0))*360.0, 1,(floor(gray*colmax/360.0)/N)),\
     HSV2B((gray*colmax/360.0-floor(gray*colmax/360.0))*360.0, 1,(floor(gray*colmax/360.0)/N))

set cbrange [0:colmax]

########################## HSVをフルに使うための設定 ここまで ######################################


############# 座標を格納するファイルの作成 ##############################

file = "angle.dat"
file_half = "angle_half.dat"

set urange [360:360+180.]
set vrange [0:360.]
set samples 63
set isosamples 63

set parametric
set zrange [0:1]
set table file
splot u,v,(0)
unset table


set urange [360:360+180.]
set vrange [0:180.]
set samples 63
set isosamples 63
set zrange [0:1]
set table file_half
splot u,v,(0)
unset table

############# 座標を格納するファイルの作成 ここまで ##############################


set term pngcairo size 600,300 font "Arial,12"
set out "3D-chiral-f-E1u.png"


kF  = 0.3   # Fermi波数
gap = 0.2   # ギャップの大きさ

Range = (kF+gap)*1.1

set xrange [-Range:Range]
set yrange [-Range:Range]
set zrange [-Range:Range]

set view 65,30
set view equal xyz
unset key

set border 0
unset xtics
unset ytics
unset ztics
unset colorbox


# pm3d: lightning オプションを含めて設定
set pm3d implicit at s hidden3d depth noborder
set pm3d lighting primary 0.3 specular 0.45
set pm3d corners2color min


set multiplot

### 左半分に、全体像をプロット ###
set tmargin screen 1
set bmargin screen 0
set rmargin screen 0.5
set lmargin screen 0


#### 超伝導ギャップ構造を定義する関数 ####
## ギャップの振幅
amp(theta,phi) = abs((5*cos(theta)**2-1)*sin(theta))/1.5
## ギャップの位相
phase(theta,phi)= (phi + (sgn(5*cos(theta)**2-1)-1)*90)- floor( (phi + (sgn(5*cos(theta)**2-1)-1)*90)/ 360.0 )* 360.0


R(theta,phi) = kF + gap*amp(theta,phi)
R0(theta,phi) = kF *0.99

splot file using (R($1,$2)*sin($1)*cos($2)):(R($1,$2)*sin($1)*sin($2)):(R($1,$2)*cos($1)):\
     (floor(amp($1,$2)*N)*360.0+phase($1,$2)) nosurface


### 左半分に、一部が欠けた像をプロット Fermi面は灰色で ###
set tmargin screen 1
set bmargin screen 0
set rmargin screen 1
set lmargin screen 0.5


splot file_half using (R($1,$2)*sin($1)*cos($2)):(R($1,$2)*sin($1)*sin($2)):(R($1,$2)*cos($1)):\
     (floor(amp($1,$2)*N)*360.0+phase($1,$2)) nosurface ,\
      "" using (R0($1,$2)*sin($1)*cos($2)):(R0($1,$2)*sin($1)*sin($2)):(R0($1,$2)*cos($1)):\
     (0xAAAAAA) nosurface lc rgb variable

unset multiplot


set out
set term win

replot
3次元カイラルf波 kz(kx+iky)2
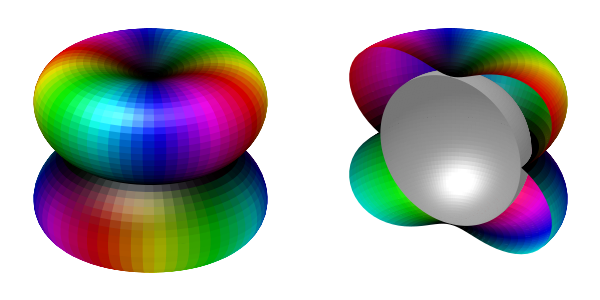
振幅と位相の定義部分を以下のように書き換えると、E2uと呼ばれるカイラルf波状態kz(kx+iky)2も描けます。北極と南極で、ギャップが2次関数的に減少している点に注目してください。
#### 超伝導ギャップ構造を定義する関数 ####
## ギャップの振幅
amp(theta,phi) = abs(sin(theta)**2*cos(theta)/0.4)
## ギャップの位相
phase(theta,phi)=2*phi + (sgn(cos(theta))-1)*90
擬2次元カイラルp波 kx+iky
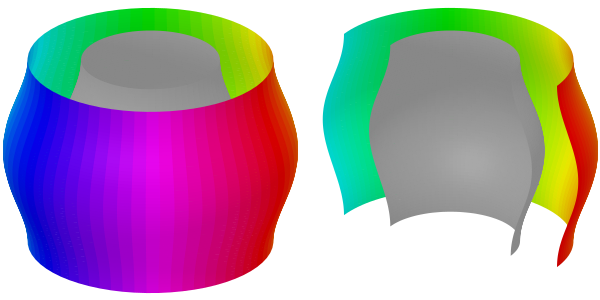
擬2次元の状態も、座標ファイルの構造を変更することで、描画することができます。
########################## HSVをフルに使うための設定  ######################################

# HSV色空間からRGB色空間への変換。Wikipedia参照
HSV_Hi(h)=sgn(h)*floor(abs(h)/60.0)%6+(h>=0 ? 0 : 5)
HSV_f(h)=(sgn(h)*(abs(h)-(floor(abs(h))/360)*360.0)/60.0+(h>=0 ? 0 : 6))-HSV_Hi(h)
HSV2R(h,s,v)=( \
     HSV_Hi(h)==0 || HSV_Hi(h)==5 ? v                    : (\
     HSV_Hi(h)==1                 ? v*(1-HSV_f(h)*s)     : (\
     HSV_Hi(h)==4                 ? v*(1-(1-HSV_f(h))*s) : (\
     HSV_Hi(h)==2 || HSV_Hi(h)==3 ? v*(1-s)              : 0.0) )))
HSV2G(h,s,v)=( \
     HSV_Hi(h)==1 || HSV_Hi(h)==2 ? v                    : (\
     HSV_Hi(h)==3                 ? v*(1-HSV_f(h)*s)     : (\
     HSV_Hi(h)==0                 ? v*(1-(1-HSV_f(h))*s) : (\
     HSV_Hi(h)==4 || HSV_Hi(h)==5 ? v*(1-s)              : 0.0) )))
HSV2B(h,s,v)=( \
     HSV_Hi(h)==3 || HSV_Hi(h)==4 ? v                    : (\
     HSV_Hi(h)==5                 ? v*(1-HSV_f(h)*s)     : (\
     HSV_Hi(h)==2                 ? v*(1-(1-HSV_f(h))*s) : (\
     HSV_Hi(h)==0 || HSV_Hi(h)==1 ? v*(1-s)              : 0.0) )))

set angles degrees
# HSVサークルの動径方向分割数
N=50.0
colmax = N*360.0
set palette model RGB functions \
     HSV2R((gray*colmax/360.0-floor(gray*colmax/360.0))*360.0, 1,(floor(gray*colmax/360.0)/N)),\
     HSV2G((gray*colmax/360.0-floor(gray*colmax/360.0))*360.0, 1,(floor(gray*colmax/360.0)/N)),\
     HSV2B((gray*colmax/360.0-floor(gray*colmax/360.0))*360.0, 1,(floor(gray*colmax/360.0)/N))

set cbrange [0:colmax]

########################## HSVをフルに使うための設定 ここまで ######################################


############# 座標を格納するファイルの作成 ##############################

file = "angle_2D.dat"
file_half = "angle_2D_half.dat"

set urange [-1:1]
set vrange [0:360.]
set samples 65
set isosamples 65
set parametric
set zrange [0:1]

set table file
splot u,v,(0)
unset table

set vrange [0:180.]
set table file_half
splot u,v,(0)
unset table

############# 座標を格納するファイルの作成 ここまで ##############################


set term pngcairo size 600,300 font "Arial,12"
set out "2D-chiral-p.png"


kF  = 0.3   # Fermi波数
gap = 0.2   # ギャップの大きさ

Range = (kF+gap)*1.1

set xrange [-Range:Range]
set yrange [-Range:Range]
set zrange [-1.5:1.5]

set view 65,30
set view equal xy
unset key

set border 0
unset xtics
unset ytics
unset ztics
unset colorbox


# pm3d: lightning オプションを含めて設定
set pm3d implicit at s hidden3d depth noborder
set pm3d lighting primary 0.2 specular 0.45
set pm3d corners2color min


set multiplot

### 左半分に、全体像をプロット ###
set tmargin screen 1
set bmargin screen 0
set rmargin screen 0.5
set lmargin screen 0


#### 超伝導ギャップ構造を定義する関数 ####
## ギャップの振幅
amp(theta,phi) = 0.98
## ギャップの位相
phase(theta,phi)=phi

warp = 0.15*kF  # Fermi面のkz方向へのワーピングを決めるパラメタ
R(z,phi) = kF + warp*cos(z*180) + gap*amp(z,phi)
R0(z,phi) = kF + warp*cos(z*180)

splot file using (R($1,$2)*cos($2)):(R($1,$2)*sin($2)):1:\
     (floor(amp($1,$2)*N)*360.0+phase($1,$2)) nosurface,\
      "" using (R0($1,$2)*cos($2)):(R0($1,$2)*sin($2)):1:\
     (0xAAAAAA) nosurface lc rgb variable


### 左半分に、一部が欠けた像をプロット Fermi面は灰色で ###
set tmargin screen 1
set bmargin screen 0
set rmargin screen 1
set lmargin screen 0.5


splot file_half using (R($1,$2)*cos($2)):(R($1,$2)*sin($2)):1:\
     (floor(amp($1,$2)*N)*360.0+phase($1,$2)) nosurface ,\
      "" using (R0($1,$2)*cos($2)):(R0($1,$2)*sin($2)):1:\
     (0xAAAAAA) nosurface lc rgb variable

unset multiplot


set out
set term win

replot
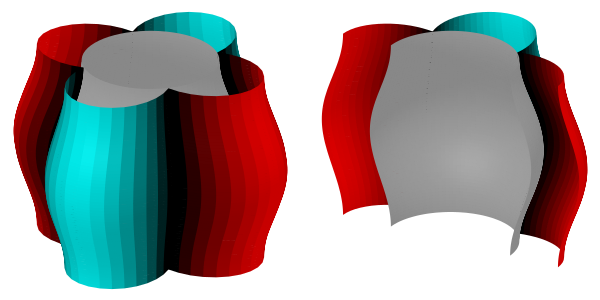
擬2次元d波 kx2-ky2
上記のスクリプトを少し変更すると、カイラルでないノードのある超伝導状態の模式図ももちろん作れます。
########################## HSVをフルに使うための設定  ######################################

# HSV色空間からRGB色空間への変換。Wikipedia参照
HSV_Hi(h)=sgn(h)*floor(abs(h)/60.0)%6+(h>=0 ? 0 : 5)
HSV_f(h)=(sgn(h)*(abs(h)-(floor(abs(h))/360)*360.0)/60.0+(h>=0 ? 0 : 6))-HSV_Hi(h)
HSV2R(h,s,v)=( \
     HSV_Hi(h)==0 || HSV_Hi(h)==5 ? v                    : (\
     HSV_Hi(h)==1                 ? v*(1-HSV_f(h)*s)     : (\
     HSV_Hi(h)==4                 ? v*(1-(1-HSV_f(h))*s) : (\
     HSV_Hi(h)==2 || HSV_Hi(h)==3 ? v*(1-s)              : 0.0) )))
HSV2G(h,s,v)=( \
     HSV_Hi(h)==1 || HSV_Hi(h)==2 ? v                    : (\
     HSV_Hi(h)==3                 ? v*(1-HSV_f(h)*s)     : (\
     HSV_Hi(h)==0                 ? v*(1-(1-HSV_f(h))*s) : (\
     HSV_Hi(h)==4 || HSV_Hi(h)==5 ? v*(1-s)              : 0.0) )))
HSV2B(h,s,v)=( \
     HSV_Hi(h)==3 || HSV_Hi(h)==4 ? v                    : (\
     HSV_Hi(h)==5                 ? v*(1-HSV_f(h)*s)     : (\
     HSV_Hi(h)==2                 ? v*(1-(1-HSV_f(h))*s) : (\
     HSV_Hi(h)==0 || HSV_Hi(h)==1 ? v*(1-s)              : 0.0) )))

set angles degrees
# HSVサークルの動径方向分割数
N=50.0
colmax = N*360.0
set palette model RGB functions \
     HSV2R((gray*colmax/360.0-floor(gray*colmax/360.0))*360.0, 1,(floor(gray*colmax/360.0)/N)),\
     HSV2G((gray*colmax/360.0-floor(gray*colmax/360.0))*360.0, 1,(floor(gray*colmax/360.0)/N)),\
     HSV2B((gray*colmax/360.0-floor(gray*colmax/360.0))*360.0, 1,(floor(gray*colmax/360.0)/N))

set cbrange [0:colmax]

########################## HSVをフルに使うための設定 ここまで ######################################


############# 座標を格納するファイルの作成 ##############################

file = "angle_2D.dat"
file_half = "angle_2D_half.dat"

set urange [-1:1]
set vrange [0:360.]
set samples 65
set isosamples 65
set parametric
set zrange [0:1]

set table file
splot u,v,(0)
unset table

set vrange [0:180.]
set table file_half
splot u,v,(0)
unset table

############# 座標を格納するファイルの作成 ここまで ##############################


set term pngcairo size 600,300 font "Arial,12"
set out "2D-d.png"


kF  = 0.3   # Fermi波数
gap = 0.2   # ギャップの大きさ

Range = (kF+gap)*1.1

set xrange [-Range:Range]
set yrange [-Range:Range]
set zrange [-1.5:1.5]

set view 65,30
set view equal xy
unset key

set border 0
unset xtics
unset ytics
unset ztics
unset colorbox


# pm3d: lightning オプションを含めて設定
set pm3d implicit at s hidden3d depth noborder
set pm3d lighting primary 0.2 specular 0.45
set pm3d corners2color min


set multiplot

### 左半分に、全体像をプロット ###
set tmargin screen 1
set bmargin screen 0
set rmargin screen 0.5
set lmargin screen 0


#### 超伝導ギャップ構造を定義する関数 ####
## ギャップの振幅
amp(z,phi) = abs(cos(phi*2))
## ギャップの位相
phase(z,phi)= 0 + (sgn(cos(phi*2))-1)*90

warp = 0.15*kF  # Fermi面のkz方向へのワーピングを決めるパラメタ
R(z,phi) = kF + warp*cos(z*180) + gap*amp(z,phi)
R0(z,phi) = (kF + warp*cos(z*180))*0.99

splot file using (R($1,$2)*cos($2)):(R($1,$2)*sin($2)):1:\
     (floor(amp($1,$2)*N)*360.0+phase($1,$2)) nosurface,\
      "" using (R0($1,$2)*cos($2)):(R0($1,$2)*sin($2)):1:\
     (0xAAAAAA) nosurface lc rgb variable


### 左半分に、一部が欠けた像をプロット Fermi面は灰色で ###
set tmargin screen 1
set bmargin screen 0
set rmargin screen 1
set lmargin screen 0.5


splot file_half using (R($1,$2)*cos($2)):(R($1,$2)*sin($2)):1:\
     (floor(amp($1,$2)*N)*360.0+phase($1,$2)) nosurface ,\
      "" using (R0($1,$2)*cos($2)):(R0($1,$2)*sin($2)):1:\
     (0xAAAAAA) nosurface lc rgb variable

unset multiplot


set out
set term win

replot